


My Journey at the Data-Driven VC Hackathon
Two days, one hackathon, and a roadmap for mapping the startup ecosystem

About a month ago, While scrolling through LinkedIn, I saw a post from the VC fund Red River West announcing a Data-Drive VC Hackathon. The event aimed to bring together students, software engineers, and venture capitalists to build innovative products over the course of two intense days
The timing was perfect. I had just wrapped up my first internship in mid-December and was waiting to start my next one, so my schedule was wide open. As someone transitioning from a Data Analyst role into VC, I saw this as the ideal opportunity to get hands-on experience in both worlds. Participating in this hackathon would not only allow me to sharpen my data skills but also immerse me in the VC ecosystem, all at once.
Motivated and excited, I signed up and that’s how I found myself heading to the Data-Driven VC Hackathon.
In this article, I’ll explore :
Overview of the Hackathon
Topics and goals
Building our MVP
Personal Thoughts
1. Overview of the Hackathon
The hackathon was the first of its kind, organized by Red River West and Biwak!, the innovation arm of BNP Paribas. The goal? To identify and tackle pain points in venture capital world by leveraging data.

Participants could tackle 4 major segments of the VC value chain :
Startup sourcing: Tracking emerging startups that align with investment thesis
Startup analysis: Evaluating team, market fit, customer acquisition of a startup …
Market Trends and Research: Understanding competitors, trends, and overall market landscapes.
VC productivity: Automation of low-value tasks to enhance efficiency
We were divided into 12 teams of about 7 people: typically, 3 students, 2 software engineers from VC funds, and a VC coach. Two additional coaches from Biwak! offered technical and business guidance throughout the two days. Our mission was to build an MVP or demo to present to a judging panel on our code, the originality of our approach, and our value proposition.
2. Topics and goals
My adventure took an interesting turn right from the start. I arrived at 8:30 pm, only to find my name missing from the participant list, which meant no badge and no official entry! Thankfully, that was sorted out quickly, and I was finally let in, but still without a team assignment.
While most participants had already joined their teams and were busy breaking the ice, I was still wandering around. After some friendly conversations, The organizers placed me in a group focused on Market Trends and Research.
Problem statement
Our team decided to create a tool that would help VCs map startups within a specific sector, grouping them into relevant sub-topics. The goal was to empower analysts and associates-especially those in generalist funds-to swiftly understand new sectors when entrepreneurs pitch ideas in unfamiliar areas
We had access to data from several sponsors (People Data Labs, Harmonic, SimilarWeb, and PredictedLeads, but at first, we weren’t sure how best to leverage it.
3. Building our MVP
Brainstorming the idea
We kick off with a brainstorming session about potential products. Team member who had previous VC experience and highlighted a common challenge: getting up to speed quickly on a new market vertical.
For instance, consider MedTech-a broad field encompassing many sub-verticals like remote monitoring, diagnostics, life sciences, and more. Our vision was to build a dynamic search-based platform where someone could type in a broad topic (like “MedTech”) and get a detailed breakdown
Sub-topics within that vertical
Key metrics
Trends over time, recent news, and relevant players
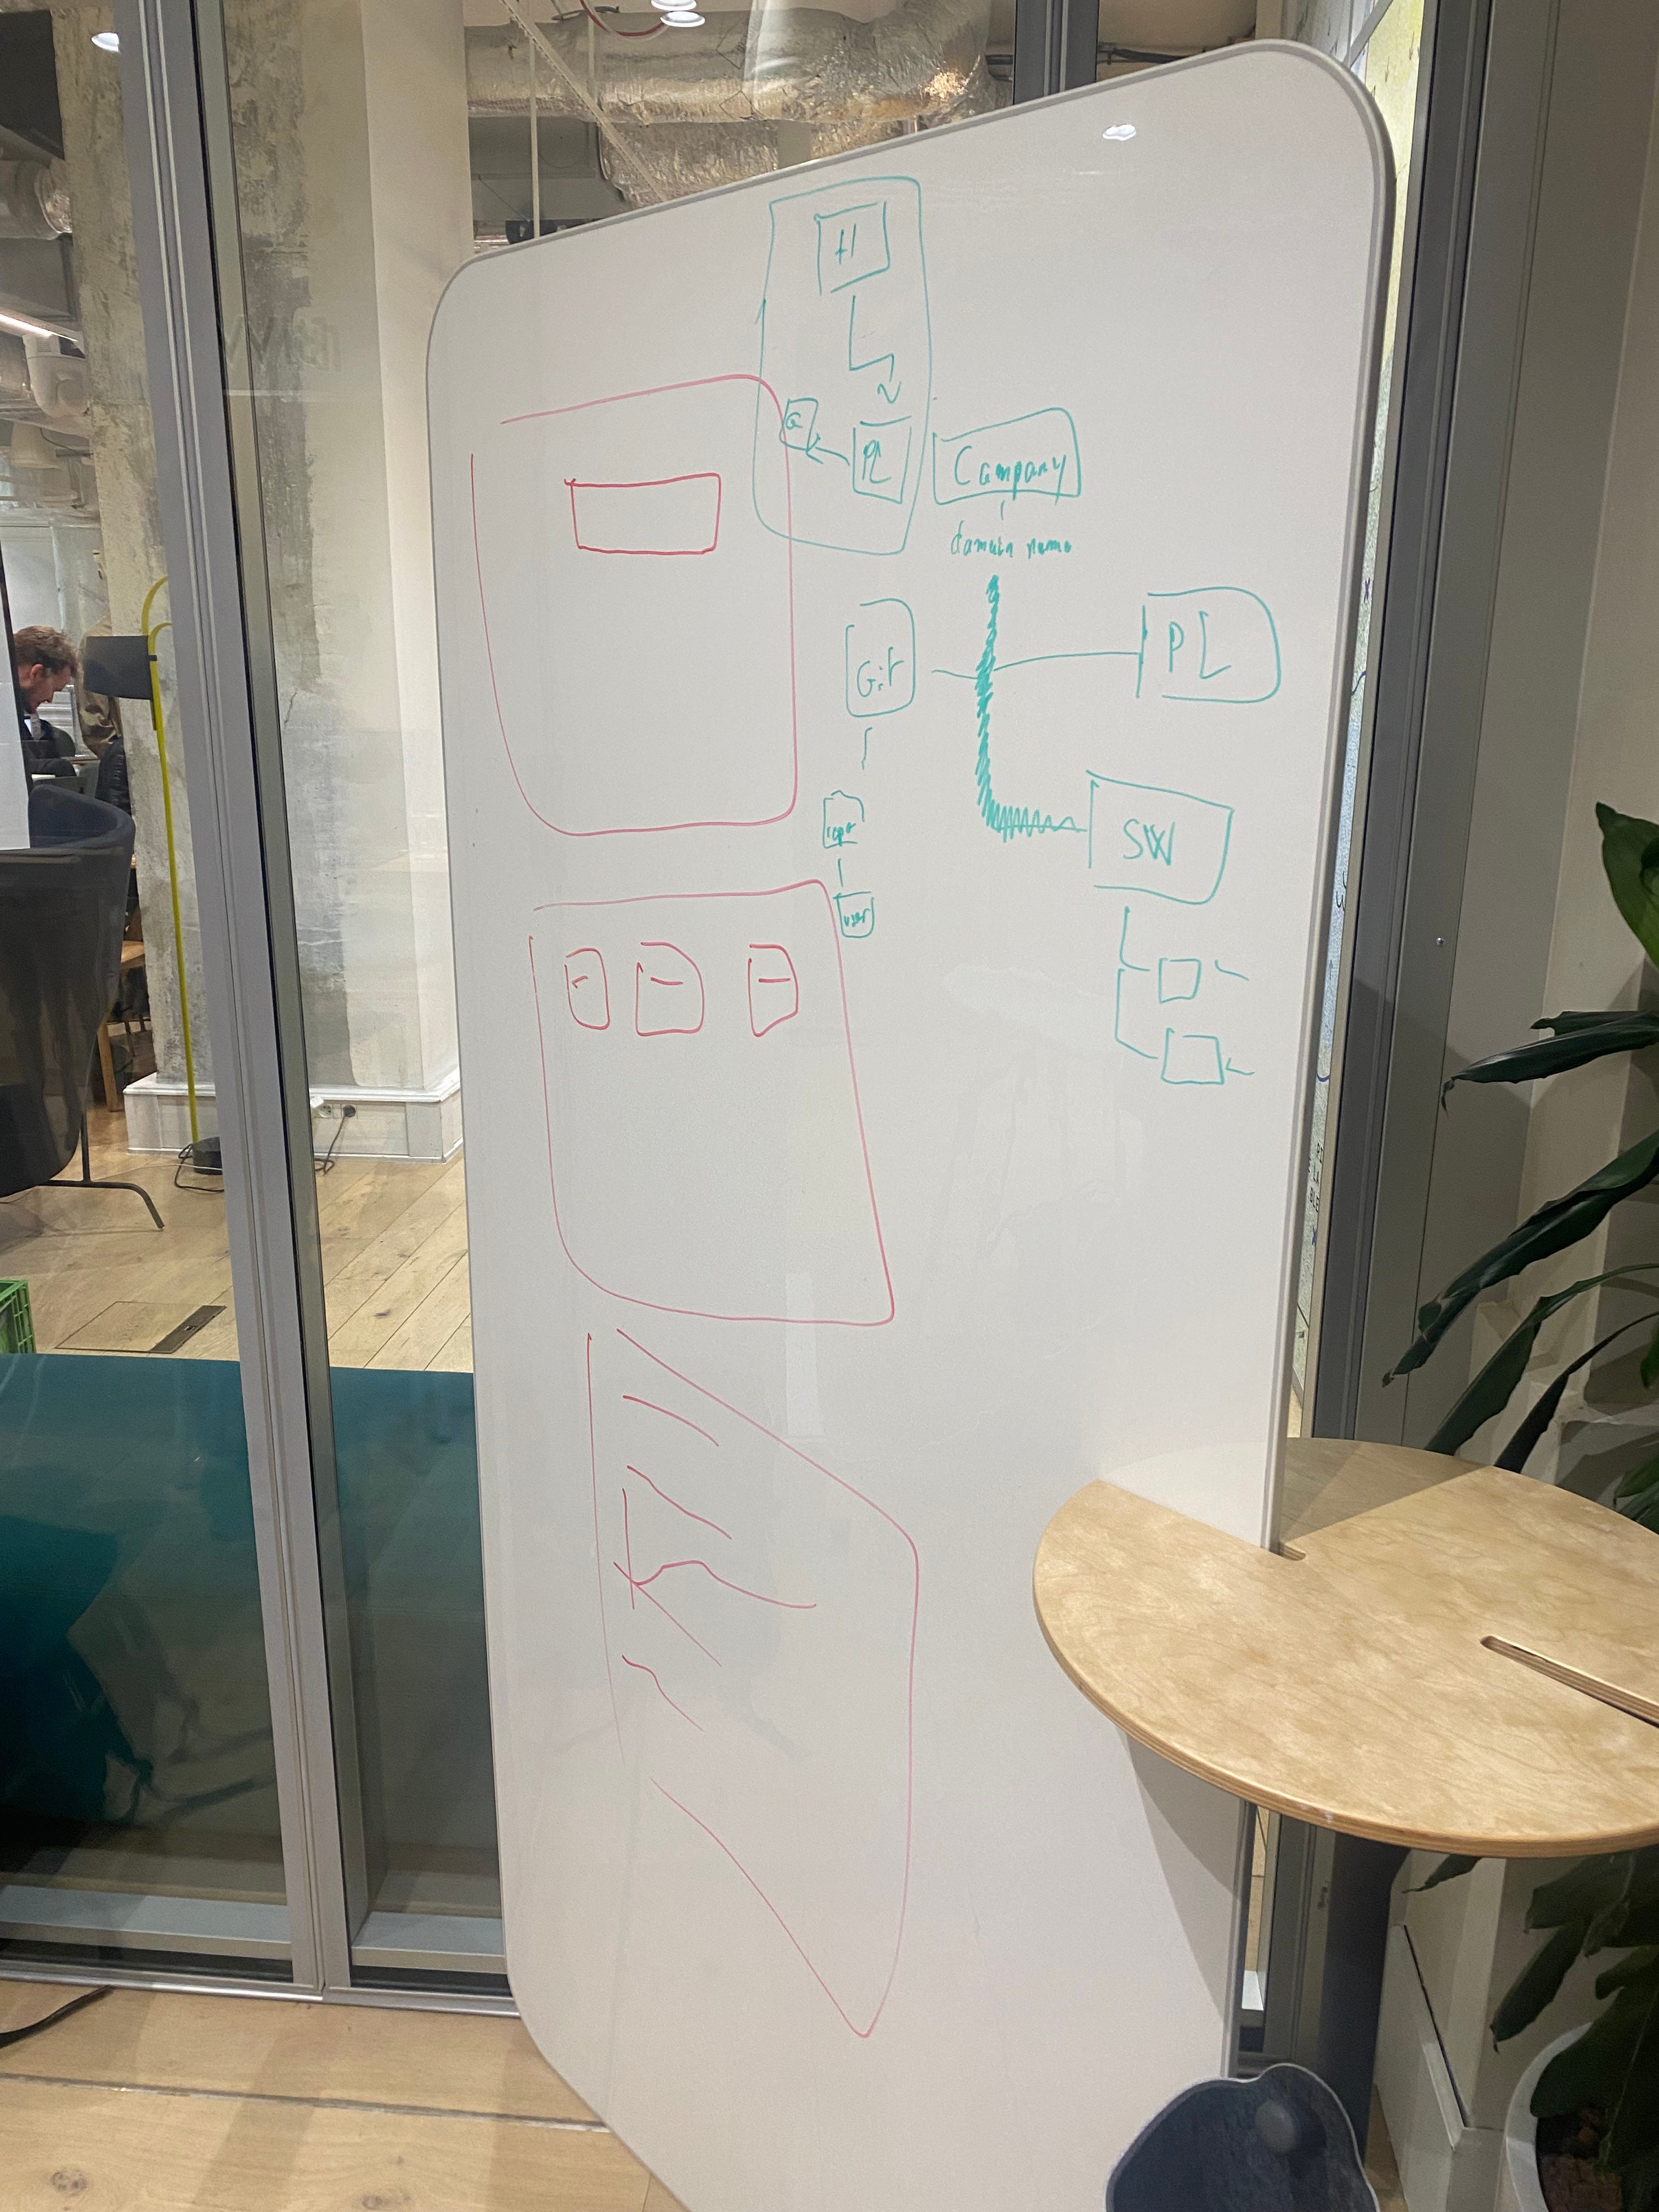
Early on, we created a rough sketch (see below). It might not look much, but it embodies our core vision:
A Search bar: Type a sector or keyword
Sub-Topic Blocks: Automatically generated groupings based on semantic similarity
Analytics and Data: Company information, key metrics, and metrics, and potentially relevant founders or experts to contact.
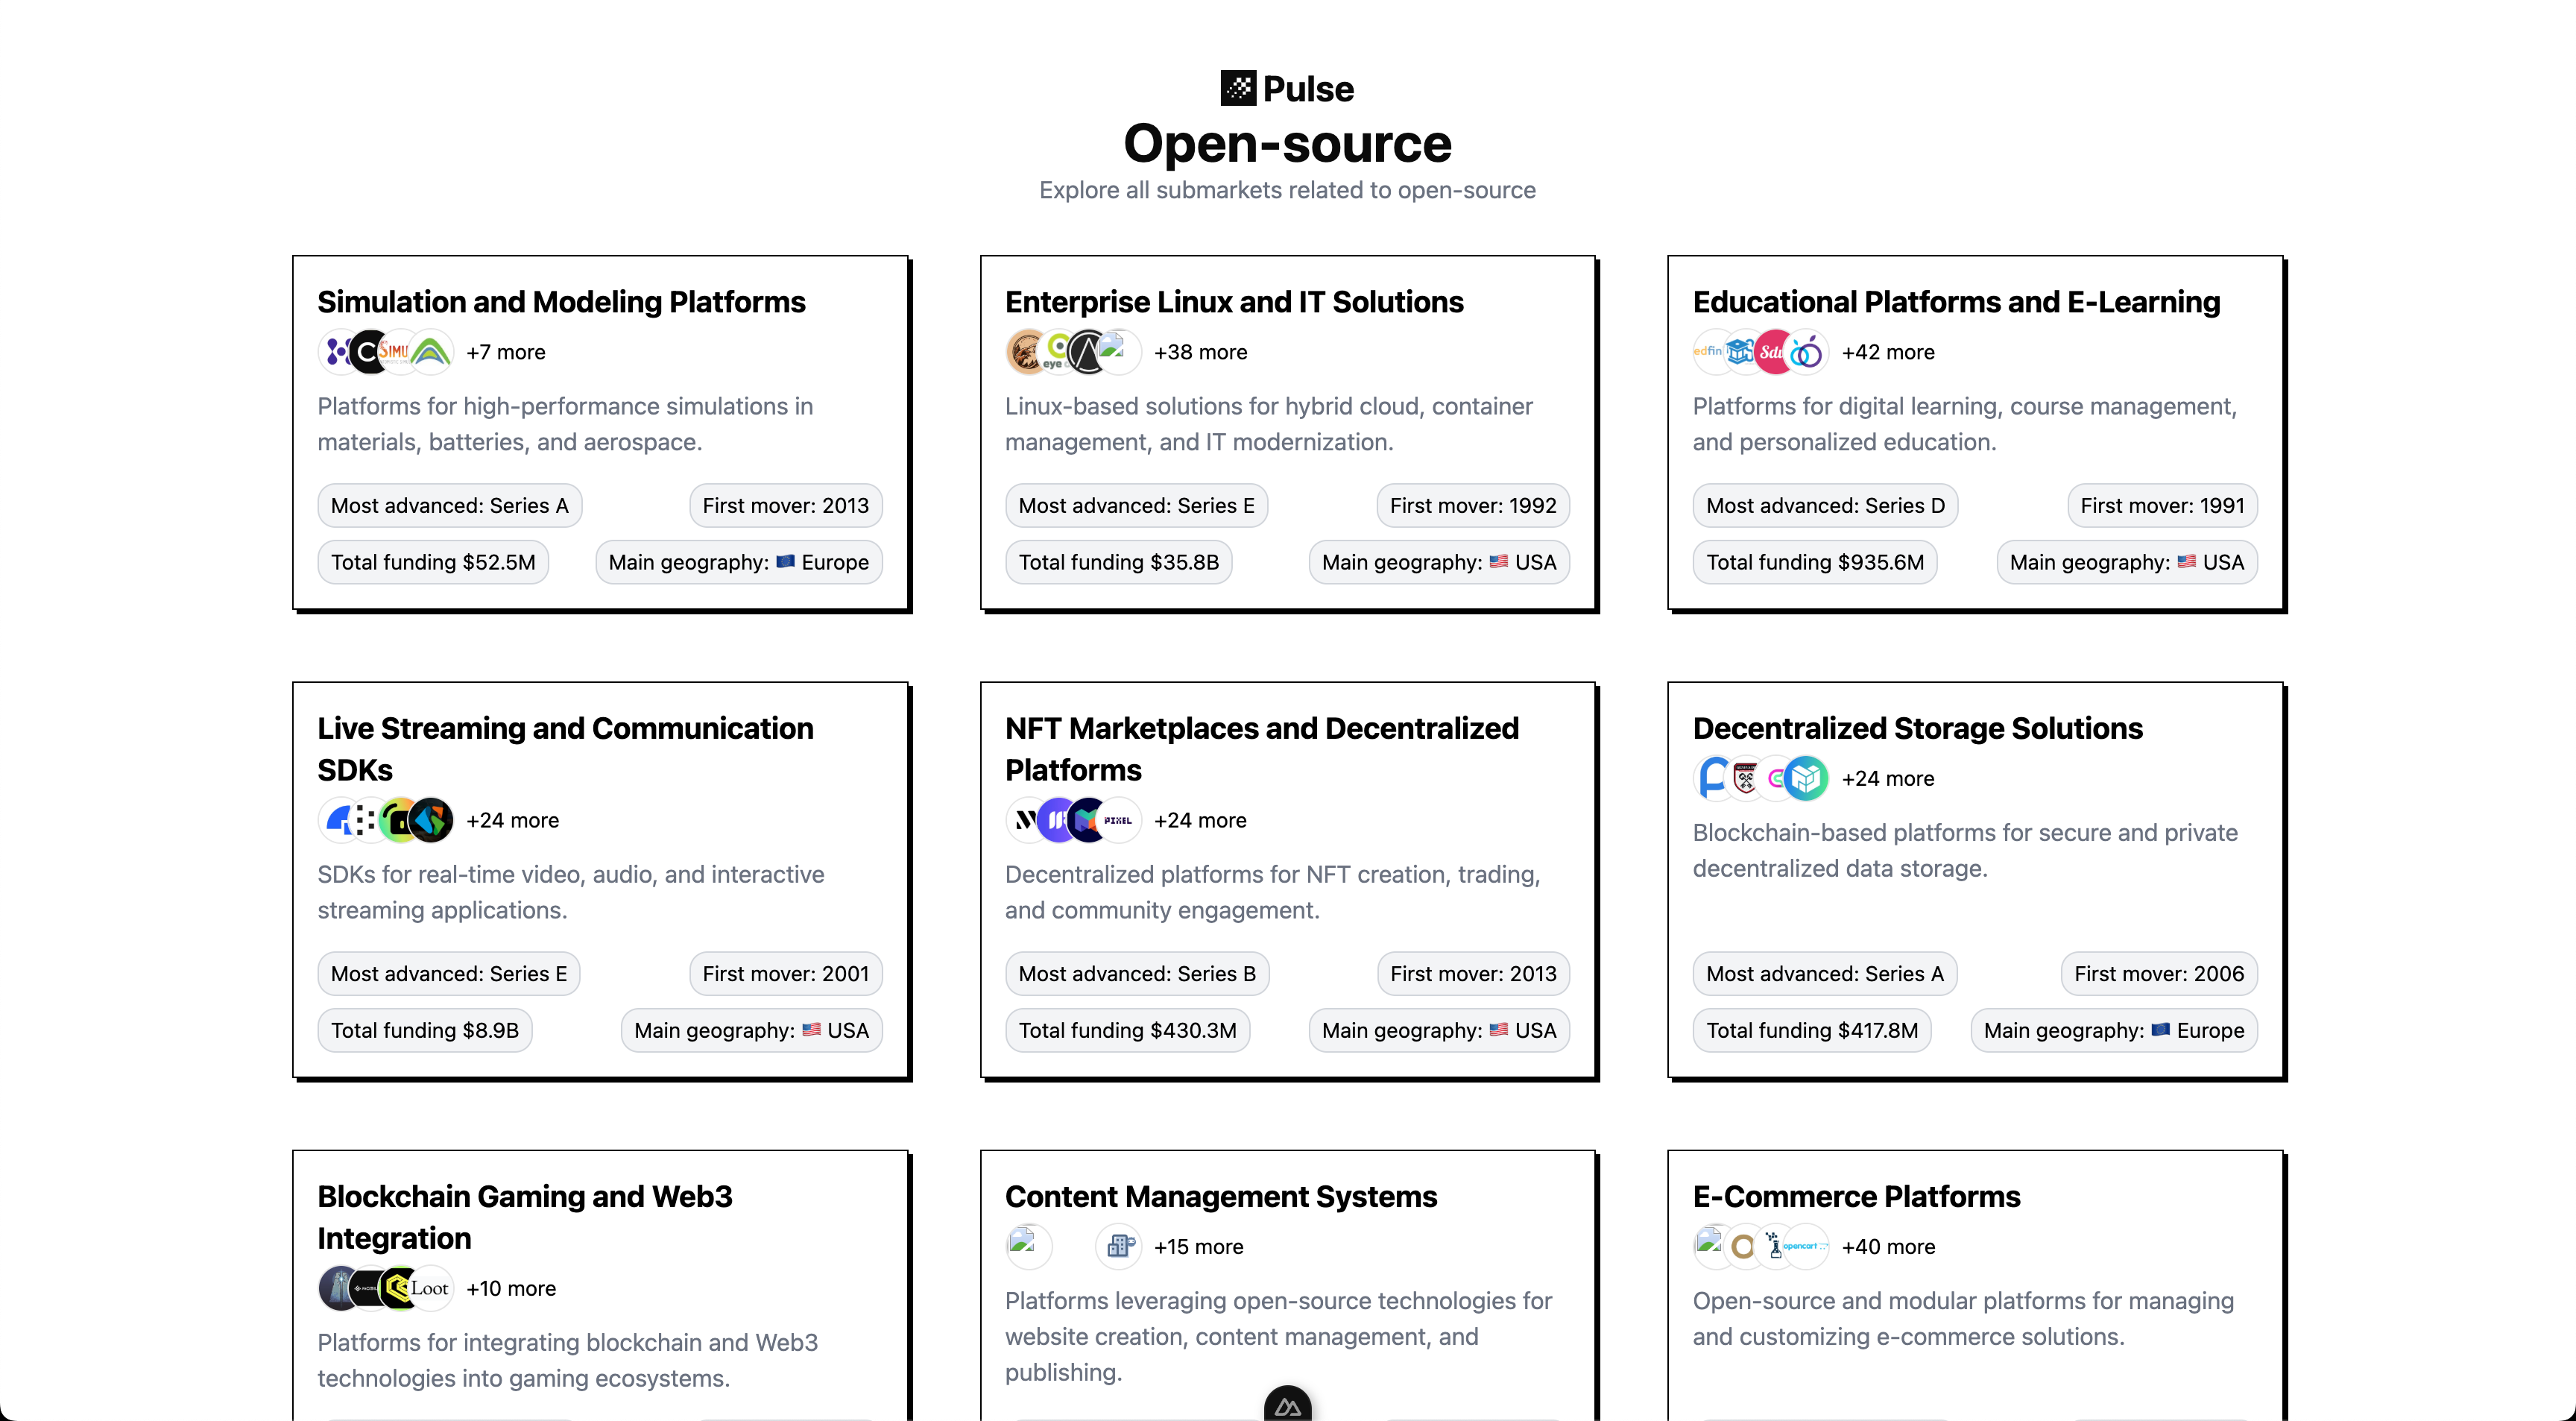
Given our time constraints, we decided to limit our prototype to the Open-Source sector.
Data Extraction & Embedding
We pulled data from multiple providers (PredictLeads, SimilarWeb, People Data Labs) and consolidated it into Supabase (PostgreSQL) as our central database. Our Biggest task was figuring out which information to gather and how to enrich it.
We then leveraged OpenAI to embed and structure the data in a way that made semantic searches possible.

Clustering with BerTopics
To further refine our classification, we used BerTopic, an open-source library designed for topic modeling and semantic clustering. This lets us group companies into coherent sub-topics under the broader “Open-Source” umbrella
Front-End
We needed rapid development in just two days. We knew that having a great front end would make a difference. Our front end was built using a Vue.js template, allowing us to integrate our data-driven insights quickly. While not fully polished, it showcased our core functionality and validated the concept.
Tech Stack Summary
Back-end: Python with SQLAlchemy
Database: PostgreSQL via Supabase
Front-End: Vue.js
Topic Modeling: BERTopic
Data Providers: Harmonic, PredictLeads, SimilarWeb, People Data Labs
4. Personal Thoughts
After two short yet intense days fueled by coffee, late-night coding, and constant brainstorming, we presented our MVP to the judges and ended up winning the hackathon! It was incredibly rewarding to see our efforts validated, especially given how quickly we had to pull everything together.
More than the win, though, the experience itself was invaluable. I got to collaborate with an amazing team of people from diverse backgrounds, learning from their expertise in both VC and software engineering. Thanks to them, I would have done nothing without them
If you’re curious to learn more about our work or want to try it yourself, feel free to check out our demo and GitHub repository.
In the end, this hackathon was a perfect snapshot of my love for data, venture capital, and people.
